
Craig Hurring is Director of Communications at The Tech Partnership. Here he tells us about one of their important products.
As any Game of Thrones fan will tell you, there’s a reason its introductory title sequence is so popular – everyone loves a good map. For centuries, maps have provided a sense of scale for our world and beyond, while opening our minds to the wonders of exploration and discovery. Technology means that today’s maps can be underpinned digitally too, with geographically tailored analytics and data providing an extra dimension of intelligence.
Which leads me a particularly good map for our own sector – the 2017 Get Digital heatmap, produced by the Tech Partnership working with Lloyds Banking Group, the London School of Economics and Political Science (LSE) and the Local Government Association.
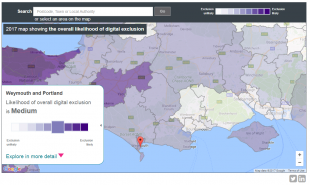
First published in 2015, the heatmap is a powerful tool for dynamically exploring localised digital exclusion levels, whether it’s your town of birth or the place where you work. So while there is plenty of optimism in the national headline figure that over one million more adults have gained some basic digital skills since we produced the 2015 heatmap, looking at a localised level on areas of high digital exclusion reminds us there’s still work to do to build a country with uniform access to digital tools and skills.
The data for the heatmap combines a range of digital metrics on connectivity to Broadband, 4G and digital usage, together with open source social metrics on age, education, income and health. In combination, this creates a tiered, 9-point scale measuring likelihood of overall exclusion (or inclusion). Common causes for exclusion include lack of skills or confidence to use technology, lack of access to devices and connectivity or not seeing relevance or importance in gaining digital skills.
In updating the heatmap, our aim is to help organisations on the ground – from local authorities to district libraries – to direct their resources in the areas and to the people who need them the most.
Karen Price, CEO of the Tech Partnership
This is important data for all our communities. I’d encourage you to spend a little time exploring this very powerful map. Check out the data underneath too, which explains the findings on a localised level. It’s all too easy for those of us working in technology day-in, day-out to assume that everyone is enjoying the convenience and benefits of being online. The heatmap offers us a powerful reminder that almost one in five UK adults still lack some basic digital skills.
We will continue to work with government and our partners to try to transform this map from a patchwork of different skill-levels to one showing that the UK is uniformly, and effectively prepared for the digital age.
Craig Hurring is Director of Communications at The Tech Partnership, the network of employers collaborating to create the skills needed for the UK digital economy, with the ambition to deliver the skills for a million digital jobs by 2025. Visit www.thetechparternship.com for more information. The Digital Heatmap is available to view at http://heatmap.thetechpartnership.com/